
Author: admin
2009 09 24 Kelowna-Yarrow Fireball

On the morning of the 24th of September I (Jeff) reported the following event to the BCMN list:
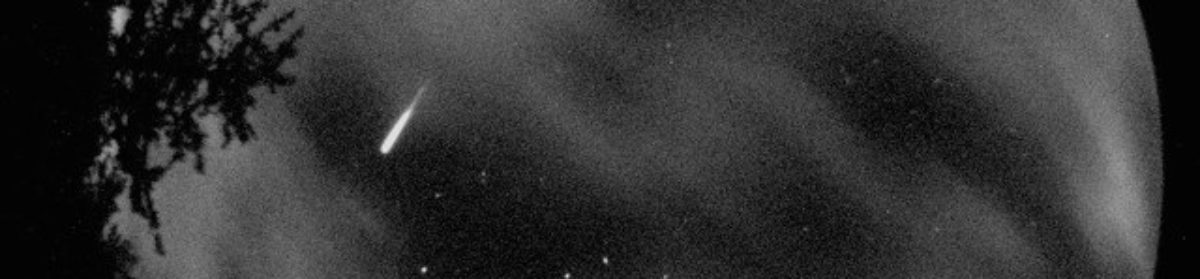
It occurred on September 24, at 09:56 UT which puts it at 02:56 PDT. It was very low on my SSW horizon. It was very slow moving with several bursts.
I then wrote Alan Hildebrand, and sent on the same information and asked him if he had any reports other than mine. He said not yet. I then sent him the movie of the bolide, a composite still picture of it and a light curve of the event. It seems most of my fireballs are low on my horizon so not that spectacular looking compared to a near zenith event.
Composite:
Here is the light output graph; the total amplitude is the summation of all pixels above the triggering threshold.

Ken Tapping, who would have a better view of it since his camera is south of mine reported back that he could not check his camera because he is out of town. No one else in our group recorded it. The terminal burst looked like it might have had a chance to be recorded by infrasound. I inquired Kris Walker and asked it was heard on the USArray infrasound array. He replied it had not.
Alan reported the fireball to the MIAC group and noted on human visual sighting from a person in Yarrow (west of Chilliwack), B.C. The report stated:
Yarrow BC
V2R 5C5
phone_home: 604-328-2864
date: 24/09/09
time: 02:50:00 am
cloud: none
latitude: 49.04585724220807
location: Just an estimate. It appeared to have landed in this mountain range.
longitude: -122.05484390258789
duration: 3
speed: Fast
flares: White ball with a colored centre. Large stadium sized bright dome of light on impact
colour: White
train: Yes, 0.5 sec
sound: Sharp
stime: 2
Note: The data folder is in the video data download category for West Kelowna/Sandia/2009_09
Sentinel Magnitude light output file
I asked Joe Chavez at Sandia National Labs what was contained in the single text file Sentinel outputs from the external video grabber.
It has this basic format:
From the Bolide of March 23, 2008
Event time: Sat 2008/03/22 04:26:41.04
-30 0 0 156.8 338.0
-29 0 0 156.8 338.0
-28 0 0 156.8 338.0
—- SNIP —-
233 1602 36538 226.4 329.6
234 1595 34884 225.4 330.2
235 1574 33285 224.5 330.7
236 1581 31824 223.6 331.3
237 1539 30273 222.5 331.9
238 1577 28940 221.4 332.3
239 1557 27557 220.3 332.8
240 1582 26090 218.9 332.9
241 1592 23868 217.2 333.3
242 1636 23007 215.7 333.3
243 1685 21843 214.1 333.4
244 1702 21038 212.6 333.6
245 1708 19880 211.1 333.6
246 1760 18637 209.6 333.6
—- SNIP —-
299 6 0 164.1 342.0
300 9 0 164.1 342.0
301 3 0 164.1 342.0
Joe informed me:
The first column shows frame counts, so each row represents about 1/30th of a second. The recording begins 30 frames (one second) before the system is triggered. The time stamp corresponds to the trigger time.
The second column shows the number of pixels that were above the threshold value.
The third column is a measure of the total amplitude and is computed by summing all pixel values above threshold. Since this value may change depending on what hardware you use, you will need to calibrate it against a known light source. We have done this by uncovering the shadow of the full moon over the sentinel camera and recording the amplitude response of the sentinel event. If you measure the amplitude response of the full moon to be XM, you can calculate the magnitude of any event of amplitude X with following formula:
Magnitude = -12.6 – 2.5 * log10( X / XM )
This assumes that the magnitude of the full moon is –12.6
The fourth column lists the X coordinate of the centroid of the event, in pixel units.
The fifth column lists the Y coordinate of the centroid of the event, in pixel units.
I have a request in to find out if the new WSentinel (internal video card) light data file uses the same equation for magnitude estimates.
Update: September 04, 2010 17:42:24
Dick Spalding responded to my WSentinel inquiry:
Jeff,
Regarding your magnitude question, I think the scaling for the new video card system should be the same as for the Sentinel box systems. However, you should be aware that for very bright events, the camera’s auto-iris feature will begin to reduce lens aperture, thus reducing the apparent brightness of the event. I don’t believe the full Moon causes the iris to be reduced, since planet brightness seems to be the same with or without the full Moon present. Iris control is based on total light on the camera’s CCD chip. So, a bright nearby light could potentially affect sensitivity by partially closing the iris.
Also, these HiCam HB-710E cameras have a built-in automatic gain control (AGC), which increases electronic gain as the scene becomes darker. For the typical dark sky, the gain is at the maximum permitted by the screwdriver AGC setting on the camera back. Turning that setting to its maximum clockwise position gives the camera maximum sensitivity. However, the resulting electronic noise produces an image with lots of “snow”, which forces trigger thresholds to be set higher. Cameras that we ship usually have their AGC control backed off to a level that puts the snow below the default trigger threshold. At that setting, I don’t think the presence of the full Moon causes the electronic gain to be reduced. Whether that’s true could be tested by lowering the threshold until random triggering on the snow begins to occur on a dark sky, then repeating with the full Moon in view. I have not done that test.
Dick Spalding
Meteor Spectroscopy and the Amateur

Written by Ed Majden
First a bit of history.
In the second half of the 1800’s attempts were made to observe meteor spectra visually using prisms. Because of the short duration of meteor phenomenon this was difficult but it was established that meteors produce discrete line spectra. The bright lines neutral sodium and neutral magnesium where correctly identified visually by experienced observers.
The first photographic meteor spectrum was secured by chance during a routine stellar spectroscopy program by Pickering in 1897 at Harvard. S. N. Blazhko in Russia set up the first successful photographic program in 1904 – 1907. This pioneer program yielded the spectra of three bright meteors. Up until 1931 only 11 meteor spectra had been secured, mostly by chance, except for the tree obtained by Blazhko. Canadian astronomer Peter M. Millman while getting his Ph.D. at Harvard was asked to look at the meteor spectra secured thus far. This resulted in two papers, the first can be down loaded at: http://adsabs.harvard.edu/abs/1937AnHar..82..113M and the second at: http://adsabs.harvard.edu/abs/1937AnHar..82..149M Peter Millman made meteor spectroscopy a life long interest and was considered a World Authority in this field.
From 1897 to 1958 the total number of known meteor spectra secured was only 318. This was partly due to the few people engaged in this field and also because it was only possible to obtain spectra of meteors brighter than -2.0 magnitude and brighter with conventional cameras and films available at this time. Most were obtained using objective prisms but in the latter part of the 1950’s transmission diffraction gratings were introduced to obtain spectra. This was a great improvement as gratings produce near linear dispersion spectra unlike prisms which have good dispersion at the blue end but crowded dispersion at the red end making line identifications more difficult.
Dr. Millman encourage amateurs to get involved in this field and he published a paper promoting this, Amateur Telescope Making – Book Two, Scientific American included this paper, Meteor Photography. Few took up this challenge because of the difficulty in securing a meteor spectrum. The technique is simple but one cannot predict where a meteor bright enough to produce a spectrum crosses the camera field of view in the correct direction so some got discouraged and did not continue trying. During this period conventional cameras fitted with a dispersive element, a grating or prism were used. At the end of WW11 good quality aero cameras hit the surplus markets at very reasonable cost and these were adopted for use as meteor spectrographs.
Millman, and later with Ian Halliday and others established the Meanook/Newbrook Meteor Observatories in Alberta and later the Spring Hill Meteor Observatory near Ottawa. The latter also used radar detection systems to study meteors in conjunction with photographic and visual observations. Sadly these programs were shut down as a result of budget cuts by the federal government. Ondrejov Observatory in the now Czech Republic became the centre to carry on this work. Others have since taken up the challenge mostly in the USA, England, Spain, and Russia.
As mentioned before it was only possible to obtain the spectra of meteors brighter than -2.0 magnitude. Hi speed cameras like the large aperture Maksutov Cameras were introduced by Gale A. Harvey NASA/LRC, in the late 1960’s and and 1970’s. These cameras were capable of producing spectra as faint as +1.0 magnitude or so. This effort produced 746 photographic meteor spectra during the four years they were in operation. The results of this was published in various journals including Sky & Telescope magazine and IAU Symposium publications.
Also during this time, TV systems were being experimented with increasing the faint magnitude capability down to around +3 visual magnitude. A paper on this, Spectroscopy of Perseid Meteors with an Image Orthicon by Peter M. Millman, A.F. Cook and C.L. Hemenway was published, refr. NRCC No. 11822 and I believe also in Sky & Telescope.
Since this time military night vision devices using image intensifiers became available and have been adopted by both professionals and some amateurs to obtain and record faint meteors and also meteor spectroscopy. Sirko Molau from the IMO runs a direct meteor recording program using image intensifiers systems and also faint lux security type cameras with fast lenses for his programs. He can be contacted at sirko@molau.de if your interested in doing this.
I personally use second generation image intensifier systems to record faint meteor spectra. As a Canadian I was lucky enough to buy a surplus 2nd Generation 25mm Image Intensifier, type MX9944/UV, before the U.S. government put export restrictions on these devices after 9/11. Now they are difficult to obtain from U.S. sellers as you have to apply for an export permit. Sometimes they are available outside of the U.S.A. so I scan eBay looking for them. New ones are probably too expensive for an amateur’s budget so one hopes that a surplus one still has some life left in it. You just take your chances buying a surplus intensifier and hope it will work. Non U.S. made intensifies are also made by other countries, Russia, China, etc. so all is not lost. I recently bought a XX1335/Q image intensifier from a British surplus dealer which is nice for meteor spectra as it has a 50mm diameter input screen which will accommodate higher dispersion spectra. I would love to get a 3rd Generation 25 mm ITT Intensifier as these have a longer life but alas the U.S. export restriction is in effect.
I once asked Canadian meteor astronomer Ian Halliday if this was still considered worth doing. He said yes, but noted that the utility of running a meteor spectroscopy program for an individual can be difficult. Conventional photographic meteor cameras require about 100 hours of exposure time to secure one spectrum. That’s a lot of film! One can of course concentrate your efforts during major meteor showers like the Perseids or Geminids to increase your chance of success. One must obtain a very good spectrum from these showers to get a professional interested in measuring your spectrum. One can of course attempt to measure your spectra yourself as there are computer programs available that are made for this purpose. Unlike stellar spectra most meteor spectra have relatively low dispersion so identifying a line can be difficult. In some cases you must have the experience in knowing the most probable line that should be present in that region. I once tried a program and had Jiri Borovicka at Ondrejov measure the same spectrum and nearly 1/2 the lines I had identified were not the correct ones even though the computer program said they were correct.
There are other issues to deal with also such as distortions produced by the lenses you use. It is very desirable to get a high dispersion spectrum but this requires a long focus lens a large grating and large format film, at least 4X5, 8X10 even better but the cost goes up exponentially. I would love to find a large grating for a Kodak F-2.5 – 12 inch focal length lens and use 8X10 film but alas, this costs money. I was lucky enough to find a surplus large reflection grating that should work using the method employed by the BAA member Mr. Aires. A reference for his BAA Journal paper can be found elsewhere on this web site. I still need to build the camera and find a source of inexpensive Tri-X or Ilford HP-5 – 8X10 film. No luck so far.
When doing spectroscopy one should try and work with another person situated 50 or so km away so heights of the start and end point can be arrived at. One can then study the height of where certain spectral lines become visible or fade out. One should also use chopping shutter to arrive at the velocity and also the spectrum of the meteor train between the shutter breaks. This also allows longer exposures as it takes longer for sky fog to build up on the film as it is exposed to the sky for 1/2 the time. Our fireball camera network is very useful as it can provide height and velocity of your meteor spectrum if your doing this on your own as I’m doing. That is, until I get others in this network interested in doing meteor spectroscopy.
We could even accomplish a first, getting the spectrum of a meteor dropping fireball and recovering the meteorite. This would answer many questions about the presents and formation of spectral lines by comparing it to the analysis of an actual recovered meteorite. One can always dream! 😉
Too bad on can’t get a large format ccd detector for meteor spectra but robbing a bank to pay for one is probably not a good idea! A Polish fireball group did have a nice success using a Canon 20D digital camera using crossed thin film gratings, a first by the way, using crossed gratings. If you do this, the direction of the meteor flight path is less important. Attached is their digital camera spectrum. They deserve congratulations! One feature is incorrectly identified as Cr at 427.4 nm. Jiri Borovicka says this is probably an Fe iron line. This spectrum is also unique as it’s in colour. B&W is preferred as this simplifies photometry intensity scans as this is established for B&W films. Jiri says this can be done with colour film also but is more complex to do.
I will try and answer any questions on meteor spectroscopy and if I can’t I will ask my friend Jiri Borovicka for an answer. Hope some of you take up the challenge!
Ed Majden
POLISH FIREBALL SPECTRUM from http://www.pkim.org/ (In Polish)
Other papers on the calibration of an all sky lens
Here are more papers on all-sky lens calibration:
A new positional astrometric method for all-sky cameras.
This link will take you to the SAO/NASA ADS Astronomy Abstract Service where you can download the pdf. Below the abstract select Printing Options and then Print Whole Paper. Next press the send pdf button. A download of the pdf will follow.
Segon, Darmir, (2009) How many stars are needed for a good camera calibration? WGN 37:3, pp. 80-83.
Houghton, John (2008) Lens Calibration Using the Stars. Web page.
Sentinel Camera Calibration

In December of 2008, after a series of back of the envelope type discussions on how to calibrate a Sentinel camera, Ken formalized the discussions in a pdf. To see Ken’s method Click here for Ken’s original paper on how we can calibrate the Sentinel camera.
As a footnote I (Jeff) did a work through with my camera system. After the spreadsheet was made and a small Python program run Ken took my results and plotted it to see how his model stood up. Here are those results.
Hi Jeff,
I could not resist having a quick look. Your data is lovely. I simply plotted
R = sqrt((x-x0)2+(y-y0)2)
against zenith angle.
In the first plot I assumed the camera zenith was (371,240), and in the second I optimized it, and got (370,231). This of course would be the camera zenith not the centre of the frame.
HOWEVER: Look at the nice clean plot and good correlation. I think you can use the camera zenith method and ignore trying to find the centre of the frame; they are obviously very close because the plot, including the very slight nonlinearity due to the fisheye effect, integrates so cleanly.
The very slight fisheye effect can be approximated more than adequately by a 2nd-order polynomial, as Martin Connors said it would.
I would say, for your system, you should be able to simply calculate R and use the equation to get the zenith angle, and then do a rotation to find the azimuth error…. job done.
Regards,
Ken
Radio Detection Basics

There are two primary methods being used by amateurs to detect meteors via forward-scatter technique; the FM method and the AM/CW method.
Prior to the 1960’s most of the radio meteor research was conducted at universities, government and military sites. As it is now, such institutions were limited by their current funding. This meant meteor observation were often spotty and they were not usually continuous over many days. They utilized radar and back-scatter techniques to detect meteors.
In the 1960’s amateur radio observers listened to a vacant commercial FM radio stations which have their channels in the 88-108 MHz range. As FM radio became more popular it quickly became harder and harder to find a vacant channel to listen for meteors. Even if a vacant was clear locally an observer might be plagued with the local stations’ ‘spilling over’ which interferes with hearing meteors echoes. Since FM, frequency modulation, there is no easy way to see the Doppler signature of a meteor.
To avoid these limitations, crowding being the biggest problem, observers started using the video carriers of television stations. The video carriers are continuous wave (CW) and narrow band in nature. In North America each of the lower TV channels had one of three possible offsets; minus, zero, and a plus offset. What this means in practice is if channel 3 is an ’empty’ channel locally, then a listener could listen for the video carrier at 61.250 MHz (Zero offset), or on either side of it at 61.260 MHz (+ offset) or at 61.240 MHZ (- offset). This provided an additional means of reducing possible interference. TV stations are also more spatially isolated than FM stations are so there is again, less chance of interference.
Compared to FM, using a CW signal also gives the observer a means of observing the Doppler signature of each echo by means of FFT (Fast Fourier Transform) routines. This enables studies on Epsilon type echoes, head echoes and other echo phenomenon. Using the Doppler of head echoes the height of a meteor can also be determined by amateurs.
Changes are in the wind
North American radio observers as well as European observers are facing a crisis. The video carrier method is on the verge of disappearing as the two continents switch from analogue TV signals to digital signals. The United States have already made the change and Canada is due in 2011. Many European stations have switched already while others linger on with analogue.
We will discuss alternatives signal sources to TV video carrier below.
Forward-Scatter
Most people wonder how it is possible to hear a meteor. The answer is when a meteor enters the upper atmosphere it begins pushing atoms aside as it penetrates the ionosphere. These high speed collisions leads to high temperature heating of the meteor. When the energy becomes sufficient the meteor begins to glow at visible light wavelengths. Not only does the leading front of the meteor glow it also creates a plasma trail behind it. We call this ablation. Mass is being converted into energy and light. The ionized plasma rapidly looses it’s energy and the electrons recombine so most meteors are a brief flash in the sky; the common shooting star we all knew as kids. Most of the visible phase of a meteor ablation occurs between 110 km and 60 km above earth’s surface.
The reason amateurs listen to TV video carriers or FM stations is because the stations provide the source of the RF, radio frequency, power that illuminates (reflects off) the meteor’s plasma trail. Commercial TV stations run 100,000 Watts (100 kW). That is a lot of power! While the stations want their signal to reach their customers’ TV sets in reality much of the signal is radiated out above the horizon and vertically into the sky itself. Usually these signals are lost to the sky as they penetrate the ionosphere without being reflected and continue out into space. If a meteor produces an ionized reflective trail then the VHF (TV and FM) signals can be reflected off the plasma and back down to earth. When the geometry is right radio observers receivers hear a brief “ping”; a musical sounding note of the signal reflecting off the meteor’s trail.
For forward-scatter work the transmitter is located well below the receiving station’s horizon. Usually we strive to have a transmitter between 600 to 1200 km away from the receiving site. See below for the geometry of forward scatter signals.
Diagram from Richardson and Knuteh (1998).
As mentioned, back-scatter is used by the professionals. In this case the receiving station is not below the horizon from the transmitter, rather, it is co-located with the transmitter. The power is borrowed as in forward-scatter it is produced by the transmitter at the site. The signal is sent from the stations transmitter outwards and the signal is reflected back to the receiver at the same location. Radar is a prime example of back-scatter.
More to follow on video carrier method… For now please see ABMO Radio page to see examples of a working TV video carrier set-up.
Hopefully, one of our members will discuss using the FM method and it will be placed here. If you are interested in the FM I highly recommend going to Ilkka Yrjöllä’s web site.
Even if you’re not interested in FM detection his discussion on forward scatter is the best I’ve seen as is his discussion on CCD, light intensifiers and other meteor subjects.
Software for automatic counting section follows:
- Spectrum Lab
- mAnalyzer
- JAnalyzer
- HROftt
- Colorgramme Lab V 2.3
- Roll your own Colorgramme
EMO Courtenay

EMO
Ed Majden’s Observatory
Courtenay, BC, CANADA
Lat: 49 deg 40′ 36.4″ N – Long: 125 deg 00′ 36.2″ W
This observatory was built with the help of friends over several years. It is a work in progress. The dome is home built, made of plywood arcs cut from 3/4″ plywood and covered with tempered masonite and then painted with neoprene sundeck coat for weather protection. Several volunteers aided in this effort but Geoff Culliton deserves a mention along with my brother-in-law Lyle Wade and friend, Frank Davis. At present it has just undergone a major refit thanks to the efforts of a good friend and colleague John Purdy. His photo is included below doing roof repairs on the building proper. John has also made special accessories for the various instruments, as he is a talented hobby machinist and amateur astronomer. Most of my colleagues are ex or retired R.C.A.F./C.A.F. veterans!
DOME CONSTRUCTION DETAILS

Dome skeleton made from 3/4 inch plywood arc sections.

Geoff Culliton screwing down dome gore sections.

John Purdy working on roof repairs.
A Sandia Bolide Detection Camera was installed on the roof thanks to Richard Spalding of Sandia Labs in the United States. This is part of a West Coast Fireball Tracking Network overseen by Dr. Jeremy Tatum, retired Professor of Physics and Astronomy at the University of Victoria. Dr. Tatum asked me to be the unofficial coordinator of this West Coast Network. He still assists with the technical work of triangulating fireballs captured by these All-sky Cameras. A picture of one of the Convex Sandia All-Sky Cameras is shown below. It operates 24 hours per day recording on 8-hour vhs tapes. A new auto recording computer capture fisheye camera is also being installed at this site. Sandia Labs in the U.S.A also provided this system. It will detect moving objects and dump the images to a PC computer hard drive. It uses a special interface box designed at Sandia Labs including a software package called Sentinel installed under the Linux operating system.

Above – Washington State fireball detection near the SE horizon! North is to the right with East at the bottom. A final joint research paper is in progress. No meteorite as yet has been found. The fireball is the bright flare at the horizon. This is a single frame capture.

Convex type Sandia All-Sky Bolide Detection Camera.
One of the main areas of research conducted at this Observatory is Meteor Spectroscopy. This work is described elsewhere on this web page.
The main observatory at present houses a Celestron C14 S.C.T. Auxiliary equipment includes an Optec SSP-3 solid state Photometer and an SBig ST-6 CCD Camera. A Celestron 8 inch Schmidt Camera will soon be added on the telescope mount for wide field photography.
One of the big problems today is light pollution. A problem most astronomers have to contend with today.
Useful papers on Spectroscopy
Here are some useful papers that can be downloaded from ADS-Harvard and the IMO.
Meteor Spectroscopy with Inexpensive Holographic Gratings
Canadian Scientists Report-XII Meteor Spectroscopy with Transmission Diffraction Gratings
Current trends in meteor spectroscopy
One hundred and fifteen years of meteor spectroscopy
High resolution spectra and monochromatic images of a flaring 1991 Perseid meteor (Using Reflection Gratings)
IMO Photographic Handbook part 3
EMO Shower Spectroscopy Results

A typical Leonid meteor spectrum secured with an image intensified video spectrograph at EMO Courtenay, B.C. CANADA is shown below. This spectrum was secured using simple equipment. An experimental grade type MX9944/UV – 2nd generation 25 mm diameter image intensifier purchased on the surplus market was used. A standard Canon F-1.4 – 50 mm lens fitted with a precision 600 g/mm blazed B&L replica transmission diffraction grating imaged the spectrum on the image intensifier input screen.
The intensifier output screen was imaged by a Super 8 video camcorder recording on a standard VHS recorder. The field of view is around 25 degrees. The “zero order” image of the meteor is on the extreme left. The “first order” spectrum is recorded with blue on the left with red to the right. The intensifier has rather limited sensitivity at the blue end so recorded lines are weak. Part of the red end of the spectrum was not recorded as it was off the screen to the right. The intensifier is mainly sensitive from around 450.0 nm to around 900.0 nm but as noted features below 450.0 nm are faint. Of special interest in this spectrum is the so called forbidden line of oxygen O I 3F recorded at 557.7 nm which is clearly recorded trailing the main spectrum. This line was first identified by Canadian astronomer, Ian Halliday in 1958. Earlier film spectra were reviewed and this was also found in an early Leonid spectrum designated as Number 29 on Millman’s World List of Meteor Spectra. See: R.A.S.C. Journal, Vol. 54, Number 4, p.189-192, August 1960.
This program was conducted on the morning of November 18, 2001. A total of 110 video meteor images were recorded during this program, 60 “zero order” images and 50 “1st order” spectra. A similar program was planned for 2002 but was unfortunately clouded out at my location.
I would like to thank Dr, Jiri Borovicka at Ondrejov Observatory in the Czech Republic for doing the scan of this spectrum.
Figure 1. Leonid spectrum. Time stamp is PST Pacific Standard Time +8 hrs for U.T.

Figure 2. Perseid Meteor Spectra
For comparison purposes a past Perseid meteor spectrum has been added. It was secured with the same set-up as above. Frame capture was done on a MAC computer and saved in grey scale format. The spectra scan is a composite carried out by Jiri Borovicka at Ondrejov Observatory.

Figure 3. Perseid spectrum. Time stamp is PDT Pacific Daylight Time + 7 hrs U.T.

Figure 4. Sample of Photographic Meteor Spectra

Figure 5. 1986 Perseid Meteor Spectrum with Objective Prism

Figure 6. 8/9 June 1997 Holographic Thin Film Grating Spectrum
This sporadic meteor spectrum in Figure 6 was obtained using a Learning Technologies thin film holographic type grating. The spectrum is undergoing measurement by Dr. Josep M. Trigo Rodriguez of the Spanish Photographic Meteor Network. This is to establish whether these inexpensive type of gratings are useful for meteor spectroscopy by amateurs. The preliminary report was published by Ed Majden as a Research Note in the Journal of the Royal Astronomical Society of Canada: Vol 92: 91-92, 1998 April JRASC

Figure 7, 1983 Objective Prism Perseid Meteor Spectrum
A faint Perseid spectrum showing the O I forbidden line of Oxygen at 557.7 nm. Not published but sent to Peter M. Millman at NRCC for his evaluation. Sadly Dr. Millman passed away so I don’t know what became of the negative.
Edward Majden – R.A.S.C. Victoria Centre – A.M.S. Meteor Spectroscopy
EMO Courtenay B.C. CANADA Lat.49o 40′ 33.5″ N-Long. 125o 00′ 37.1 W (GPS)