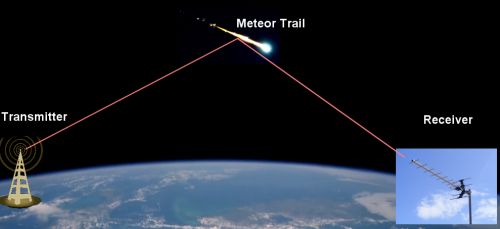
FORUM

You need to log in to create posts and topics. Login · Register

Forum

EquipmentLast post
How Do I acquire equipment?What equipment should I buy?
0 Topics
0 Posts
No topics yet!
General - Club, website Admin etcLast post
WebsiteIdeas for improvement of Website
0 Topics
0 Posts
No topics yet!
MembershipMembership
0 Topics
0 Posts
No topics yet!
ScienceLast post
EducationLast post
In this category are no forums yet!
IncidentsLast post
New posts · No new posts · Mark All Read
Statistics
10
Topics
18
Posts
11,531
Views
5
Users
0
Online
Newest Member: Ed Majden · Currently nobody is online.

Radio Detection Basics – Software – mAnalyzer


mAnalyzer

This software was written by Esko Lyytinen and his son Ölle. It is freeware. It is not used by many observers any more as it is getting a bit dated. It does however,  have several features going for it.

  1. It can be used on old, less capable computers running Windows95 and up.
  2. It has a very small foot print memory and hard drive wise
  3. It is not a cpu hog.
  4. It automatically records four amplitude ranges and records the duration of echoes for each amplitude category.
  5. It prints files every 10 minutes and hourly
  6. The file output format is supported by Colorgramme/Color Lab so can be used for automatic ftp to the RMOB live site.
  7. A 24 hour spectrogram image is saved at the end of the day.
  8. It has the ability to notch out a carrier in the echo count pass band if needed.
  9. Compares a 100 Hz pass band for echo signals and compares it to a nearby noise band.
  10. No scripts or programming needed, it’s plug and play.
  11. Runs for months without attention.

For the reasons listed above I run mAnalyzer in parallel with Spectrum Lab as cheap insurance.  It has saved critical data several times over the year when others have failed for various reasons.

Here is a sample of the 24 hour image produced by mAnalyzer (size has been reduced):

mANalyzer 24 hr

Blue hash marks are minute marks, light blue are ten minute markers, and red are the hourly markers. It takes two line per hour. This compressed time scale is an aide in seeing Es, sporadic E interference, aurora, and broadband noise that often affect the counts. This image was produced on 2010-01-03, the day of the Quadrantids peak. As can be seen there are two bands of clustered echo returns. Between the two is a few hours with less echoes than either side. This is a somewhat common occurrence caused by the radiant of the shower moving through the 45 degree elevations of the station’s site (maximum echoes at the two 45 degree points).

The format of the hourly result file (mhdata.txt) looks like this:

201001031000    10    0.043271    206
201001031100    11    0.043342    221
201001031200    12    0.052527    274
201001031300    13    0.051171    272
201001031400    14    0.052452    288

YYYYMMDDHHMM  UT hour  duration (percentage of period) and echo count for the hour.

The 10 minute file (mdata.txt) has this format:

201001031400,0.956661,0.015585,0.016652,0.010675,0.000427,0.000000,0.000000,27.817250,   11,   19,   15,    1,    0
201001031410,0.945536,0.018368,0.022426,0.013669,0.000000,0.000000,0.000000,28.487399,   15,   17,   20,    0,    0
201001031420,0.950897,0.015585,0.024125,0.009394,0.000000,0.000000,0.000000,27.483348,   12,   20,   14,    0,    0
201001031430,0.942357,0.022630,0.025833,0.008540,0.000213,0.000000,0.000427,27.523708,   17,   19,   12,    1,    0
201001031440,0.952818,0.020068,0.020709,0.005978,0.000000,0.000000,0.000427,27.587142,   19,   16,   12,    0,    0
201001031450,0.936166,0.021136,0.023271,0.019214,0.000213,0.000000,0.000000,28.522844,   12,   16,   19,    1,    0
201001031500,0.963691,0.016446,0.013242,0.006621,0.000000,0.000000,0.000000,27.663178,   20,   19,   10,    0,    0

Left to right:

  1. YYYYMMDDHHMM
  2. Percentage of time with no signal
  3. Percentage of time with Level 1 echoes 1-10 dB
  4. Percentage of time with Level 2 echoes 11-20 dB
  5. Percentage of time with Level 3 echoes 21-30 dB
  6. Percentage of time with Level 4 echoes 31-40 dB
  7. Percentage of time with Level 5 echoes > 40 dB Not used
  8. Percentage of time with with possible noise or interference
  9. Audio Index shows jumps if receiver volume control or sound card sound input changes.
  10. Level 1 echo counts 1-10 dB
  11. Level 2 echo counts 11-20 dB
  12. Level 3 echo counts  21-30 dB
  13. Level 4 echo counts 31-40 dB
  14. Level 5 echo counts > 40 dB Not used

Video Software Systems

Software systems:

Sentinel II

The Sentinel II was earliest of the Sentinel camera system used by the BCMN. It used a convex mirror with the camera above the reflecting mirror. Video was feed into a VCR. Users then scanned the nights catch the next day or when there was a report of a fireball.

Credit: Ed Majden

Sentinel III

This system is still in use by many of the operators of the BCMN. The camera and associated hardware can be seen in a picture essay here Sentinel III system in photos. The system uses an external frame grabber which has firmware burned into a EPROM chip. The frame grabber has an IP address of 10.0.0.1 and communicates with the host computer via a Null type ethernet cable.

Pros:

  1. The software runs on very old, less capable computers without straining them.
  2. The software can run multiple platforms/systems as is.
  3. Software is written in a clear logical way and can be modified easily.
  4. Stable and will run for months at a time.

Cons:

  1. The external frame grabber takes time to download the capture to the software so some meteors are missed during this transaction.
  2. Frame grabber ties up an Ethernet port
  3. On some routers it is impossible to run a net time server due to the 10.0.0.# addressing or port loss.
  4. No stacking of images to bring out the stars. The make long exposure after event helps but is not that powerful.
  5. Shelf space taken up by external frame grabber, cable, and power supply cords.

Sentinel IV

Is the next generation in the Sentinel line. This system employs an internal video card; the Hauppauge ImpactVCB model 188 board.

The software is in beta testing so it is hard to list the pros and the cons. Many of the cons have been squashed in the last couple of upgrades. When fully developed the software is suppose to automatically ftp the events back to New Mexico where it will be analyzed. This feature has not been implemented as of yet.

Pros:

The biggest improvement is the near real time capture and data writing. There are no longer dead seconds (sometimes minutes) while the card downloads to the computer. This leads to much less loss of data during showers.  It does have a method to simulate stacking frames that helps define dimmer stars.

I see two cons so far. The first is the software’s dependence on Windows system software. I can not be run on Linux or Mac computers without going to a virtual machine and running Windows. I see this as a big step backwards although Window users will not be that impacted by the switch. The other con is the code is compiled so there is no way to easily read  or modify the source code.

It is too soon to tell how stable the final version of the software will be or what planned features will make the final cut.


UFOCapture

Unlike Sentinel software UFOCaptureV2 (V2.22  2008/11/28) is not freeware, it is a commercial product. There are two other sets of software that analyze the UFOCapture files, UFOAnalyzer V2 (V2.28 2010/02/28)  and UFO Oribit (V2.25 2010/02/28). They both are freeware and they will be covered in the Video Analysis section.

Pros:

  1. Works with multiple camera types.
  2. Highly flexible can fine tune to observer’s needs.
  3. Overlays a Time stamps on the video images.
  4. Easy to make masking
  5. Software notes and produces scintillation masks.
  6. Can fine tune the triggering and greatly reduce or eliminate aircraft, spiders, and bird triggers.
  7. Records more stars than Sentinel does during exposures.
  8. Multiple meteor capture possible
  9. Coupled with the two associate analysis software the trio gives the user a very powerful tool, especially with multi-station captures.


Cons:

  1. Needs a video to digital card like Canopus or the Hauppauge card that comes with Sentinel IV.
  2. Expensive license versus freeware and shareware.
  3. The manual was originally written in Japanese and the English translation is fairly choppy and hard to understand at times.
  4. Eats up a lot cpu cycles so a newer, faster and more capable computer is needed compared to a Sentinel system
  5. The software is so full of features it presents a steep learning curve before feeling at ease with it.


HandAvi


Note: Video Analysis software will be covered in the Analysis section of this site.

Camera Systems Introduction

Camera systems currently in use by network members include the Sentinel camera a Sony, the Watec 902H, and the PC164CEX-2.

Sentinel camera:

The Sentinel III camera is a Sony HiCam HB-710E. The CCD (Charge Coupled Device) is a 1.27 cm (0.5 inch) interlined chip with 410K pixels. Effective Pixels 768 (Horizontal) X 494 (Vertical). It has a super-low illumination environment of 0.0005 Lux(F1.2 /20 IRE at AGC Max). It is powered by +12VDC and consumes 150 mA at maximum load.

The lens is Rainbow L163VDC4P fisheye lens with a 180 degree field.

For a pictorial tour of the Sony HiCam HB-710E camera, it’s housing and frame grabber click here.

The Sentinel – video frame grabber comes in an external box. It contains a micro-controller, a RCM3200, from Rabbit Semiconductor. There are three connections on the box, 1) +3.3V DC input, 2) a BNC male connector for the 1Vp-p video input from the Sony camera via 75 ohm coax, and 3) an Ethernet jack. The frame grabber communicates with a PC via the ethernet cable either directly with a crossover cable or through a LAN hub via a conventional ethernet cable.

The Sentinel III system is being replaced by the Sentinel IV system which uses the same camera but uses an internal Hauppaugue model 188 video  card.

Watec 902H

PC164CEX-2

acrylic domes from EZ Tops in New Brunswick.

fisheye lens, sources

Preparation for Calibrating a Sentinel Camera

Steps to take prior to calibrating a Sentinel Camera

Flesh out – PLACEHOLDER ONLY!

Put the procedure here.

  1. Make long exposure after each capture… TIF format
  2. Use GIMP, Paint, PhotoShop or other image processing program and push the brightness and contrast
  3. After photo brings out the hidden starts run a planetarium program. Looking south, elv 90, fov 180.
  4. Match the stars noting pixel x/y on photo and az/el on the planetarium.
  5. run python program calpos.py This produces a personalized correction file that will be used for triangulation. (See Ken’s pdf on the process)

Sentinel III system in photos – Final Page

The Sentinel Video box, the frame grabber, the red face box with black power cord (left) and video input coax on the right.

Vid2

Close up of the Sentinel Video box (frame grabber). Coax video input via BNC and DC input +3.3 V.

Close up video

Sentinel III system in photos – Page three of Sentinel III

The DIP switches (4), Level and AGC adjust potentiometers, plus power, and auto focus attachments at base of the Sony HB-710E.
Dip
The bottom section that houses the AC cord (white) and the video coax plus video output jacks with RCA to BNC converter.
Bottomof the stack

Once adjustments were made and lens centred on CCD chip the system was reassembled and the acrylic dome placed over the lens.

Dome

Sentinel III system in photos – Page 2

Once the top section tube is removed the heater (consisting of two 50 watt metal case power resistors plus heat sink plate),
the thermostat, circulating fan, the tube supports and camera are revealed.

Here is a close up of thermostat control. It is set at 100 F (37.7 C)which prevents dew or ice from forming on the dome.

Thermostat

Close up of the Rainbow L163VDC4P fisheye lens adjustment levers. Protective cap over the lens.

Lens adjust

The Sony HiCam HB-710E camera body.

Camera body

Sentinel III System in Photos

The Camera and Housing

The housing for the camera, the anti-dew heater, the thermostat,  and fan are all housed inside a PVC tube and toilet flange. 
As packed for shipping. Stands approximately 0.5 meter tall.

As Packed for shipping

Top shipping end removed reveals the camera and baffle.

Top Baffle

The Rainbow L163VDC4P fisheye lens mounted on the camera body. Note the PVC stiffener rods with coax cable running through it..

fisheye lens


Sentinel Camera Calibration

In December of 2008, after a series of back of the envelope type discussions on how to calibrate a Sentinel camera, Ken formalized the discussions in a pdf. To see Ken’s method Click here for Ken’s original paper on how we can calibrate the Sentinel camera.

As a footnote I (Jeff) did a work through with my camera system. After the spreadsheet was made and a small Python program run Ken took my results and plotted it to see how his model stood up. Here are those results.

Hi Jeff,

I could not resist having a quick look. Your data is lovely. I simply plotted

R = sqrt((x-x0)2+(y-y0)2)

against zenith angle.

In the first plot I assumed the camera zenith was (371,240), and in the second I optimized it, and got (370,231). This of course would be the camera zenith not the centre of the frame.

HOWEVER: Look at the nice clean plot and good correlation. I think you can use the camera zenith method and ignore trying to find the centre of the frame; they are obviously very close because the plot, including the very slight nonlinearity due to the fisheye effect, integrates so cleanly.

The very slight fisheye effect can be approximated more than adequately by a 2nd-order polynomial, as Martin Connors said it would.

I would say, for your system, you should be able to simply calculate R and use the equation to get the zenith angle, and then do a rotation to find the azimuth error…. job done.

Regards,

Ken

Brower's Correction Graph