Sentinel Camera Calibration

In December of 2008, after a series of back of the envelope type discussions on how to calibrate a Sentinel camera, Ken formalized the discussions in a pdf. To see Ken’s method Click here for Ken’s original paper on how we can calibrate the Sentinel camera.

As a footnote I (Jeff) did a work through with my camera system. After the spreadsheet was made and a small Python program run Ken took my results and plotted it to see how his model stood up. Here are those results.


Hi Jeff,

I could not resist having a quick look. Your data is lovely. I simply plotted

R = sqrt((x-x0)2+(y-y0)2)

against zenith angle.

In the first plot I assumed the camera zenith was (371,240), and in the second I optimized it, and got (370,231). This of course would be the camera zenith not the centre of the frame.

HOWEVER: Look at the nice clean plot and good correlation. I think you can use the camera zenith method and ignore trying to find the centre of the frame; they are obviously very close because the plot, including the very slight nonlinearity due to the fisheye effect, integrates so cleanly.

The very slight fisheye effect can be approximated more than adequately by a 2nd-order polynomial, as Martin Connors said it would.

I would say, for your system, you should be able to simply calculate R and use the equation to get the zenith angle, and then do a rotation to find the azimuth error…. job done.

Regards,

Ken


Radio Detection Basics

There are two primary methods being used by amateurs to detect meteors via forward-scatter technique; the FM method and the AM/CW method.

Prior to the 1960’s most of the radio meteor research was conducted at universities,  government and military sites. As it is now,  such institutions were limited by their current funding. This meant meteor observation were often spotty and they were not usually continuous over many days. They utilized radar and back-scatter techniques to detect meteors.

In the 1960’s amateur radio observers listened to a vacant commercial FM radio stations which have their channels in the 88-108 MHz range. As FM radio became more popular it quickly became harder and harder to find a vacant channel to listen for meteors. Even if a vacant was clear locally an observer might be plagued with the local stations’ ‘spilling over’ which  interferes with hearing meteors echoes. Since FM, frequency modulation, there is no easy way to see the Doppler signature of a meteor.

To avoid these limitations, crowding being the biggest problem, observers started using the video carriers of television stations. The video carriers are continuous wave (CW) and narrow band in nature. In North America each of the lower TV channels had one of three possible offsets; minus, zero, and a plus offset. What this means in practice is if channel 3 is an ’empty’ channel locally, then a listener could listen for the video carrier at 61.250 MHz (Zero offset), or on either side of it at 61.260 MHz (+ offset) or at 61.240 MHZ (- offset).  This provided an additional means of reducing possible interference. TV stations are also more spatially isolated than FM stations are so there is again, less chance of interference.

Compared to FM, using a CW signal also gives the observer a means of observing the Doppler signature of each echo by means of FFT (Fast Fourier Transform) routines. This enables studies on Epsilon type echoes, head echoes and other echo phenomenon. Using the Doppler of head echoes the height of a meteor can also be determined by amateurs.

Changes are in the wind

North American radio observers as well as European observers are facing a crisis. The video carrier method is on the verge of disappearing as the two continents switch from analogue TV signals to digital signals. The United States have already made the change and Canada is due in 2011. Many European stations have switched already while others linger on with analogue.

We will discuss alternatives signal sources to TV video carrier  below.

Forward-Scatter

Most people wonder how it is possible to hear a meteor. The answer is when a meteor enters the upper atmosphere it begins pushing atoms aside as it penetrates the ionosphere. These high speed collisions leads to high temperature heating of the meteor. When the energy becomes sufficient the meteor begins to glow at visible light wavelengths. Not  only does the leading front of the meteor glow it also creates a plasma trail behind it. We call this ablation. Mass is being converted into energy and light. The ionized plasma rapidly looses it’s energy and the electrons recombine so most meteors are a brief flash in the sky; the common shooting star we all knew as kids. Most of the visible phase of a meteor ablation occurs between 110 km and 60 km above earth’s surface.

The reason amateurs listen to TV video carriers or FM stations is because the stations provide the source of the RF, radio frequency, power that illuminates (reflects off) the meteor’s plasma trail. Commercial TV stations run 100,000 Watts (100 kW). That is a lot of power! While the stations want their signal to reach their customers’ TV sets in reality much of the signal is radiated out above the horizon and vertically into the sky itself. Usually these signals are lost to the sky as they penetrate the ionosphere without being reflected and continue out into space. If a meteor produces an ionized reflective trail then the VHF (TV and FM) signals can be reflected off the plasma and back down to earth. When the geometry is right radio observers receivers hear a brief “ping”; a musical sounding note of the signal reflecting off the meteor’s trail.

For forward-scatter work the transmitter is located well below the receiving station’s horizon. Usually we strive to have a transmitter between 600 to 1200 km away from the receiving site. See below for the geometry of forward scatter signals.

Diagram from Richardson and Knuteh (1998).

As mentioned, back-scatter is used by the professionals. In this case the receiving station is not below the horizon from the transmitter, rather, it is co-located with the transmitter. The power is borrowed as in forward-scatter it is produced by the transmitter at the site.  The signal is sent from the stations transmitter outwards and the signal is reflected back to the receiver at the same location. Radar is a prime example of back-scatter.

More to follow on video carrier method… For now please see ABMO Radio page to see examples of a working TV video carrier set-up.

Hopefully, one of our members will discuss using the FM method and it will be placed here. If you are interested in the FM I highly recommend going to Ilkka Yrjöllä’s web site.

Even if you’re not interested in FM detection his discussion on forward scatter is the best I’ve seen as is his discussion on CCD, light intensifiers and other meteor subjects.


Software for automatic counting section follows:

  1. Spectrum Lab
  2. mAnalyzer
  3. JAnalyzer
  4. HROftt
  5. Colorgramme Lab V 2.3
  6. Roll your own Colorgramme


EMO Courtenay

EMO
Ed Majden’s Observatory
Courtenay, BC, CANADA

Lat: 49 deg 40′ 36.4″ N – Long: 125 deg 00′ 36.2″ W

This observatory was built with the help of friends over several years. It is a work in progress. The dome is home built, made of plywood arcs cut from 3/4″ plywood and covered with tempered masonite and then painted with neoprene sundeck coat for weather protection. Several volunteers aided in this effort but Geoff Culliton deserves a mention along with my brother-in-law Lyle Wade and friend, Frank Davis. At present it has just undergone a major refit thanks to the efforts of a good friend and colleague John Purdy. His photo is included below doing roof repairs on the building proper. John has also made special accessories for the various instruments, as he is a talented hobby machinist and amateur astronomer. Most of my colleagues are ex or retired R.C.A.F./C.A.F. veterans!

DOME CONSTRUCTION DETAILS

Dome1A

Dome skeleton made from 3/4 inch plywood arc sections.


DOme2a

Geoff Culliton screwing down dome gore sections.


John Purdy working on roof

John Purdy working on roof repairs.

A Sandia Bolide Detection Camera was installed on the roof thanks to Richard Spalding of Sandia Labs in the United States. This is part of a West Coast Fireball Tracking Network overseen by Dr. Jeremy Tatum, retired Professor of Physics and Astronomy at the University of Victoria. Dr. Tatum asked me to be the unofficial coordinator of this West Coast Network. He still assists with the technical work of triangulating fireballs captured by these All-sky Cameras. A picture of one of the Convex Sandia All-Sky Cameras is shown below. It operates 24 hours per day recording on 8-hour vhs tapes. A new auto recording computer capture fisheye camera is also being installed at this site. Sandia Labs in the U.S.A also provided this system. It will detect moving objects and dump the images to a PC computer hard drive. It uses a special interface box designed at Sandia Labs including a software package called Sentinel installed under the Linux operating system.


WA Fireball


Above – Washington State fireball detection near the SE horizon! North is to the right with East at the bottom. A final joint research paper is in progress. No meteorite as yet has been found. The fireball is the bright flare at the horizon. This is a single frame capture.

Convex Sentinel Camera


Convex type Sandia All-Sky Bolide Detection Camera.

One of the main areas of research conducted at this Observatory is Meteor Spectroscopy. This work is described elsewhere on this web page.

The main observatory at present houses a Celestron C14 S.C.T. Auxiliary equipment includes an Optec SSP-3 solid state Photometer and an SBig ST-6 CCD Camera. A Celestron 8 inch Schmidt Camera will soon be added on the telescope mount for wide field photography.

One of the big problems today is light pollution. A problem most astronomers have to contend with today.

Useful papers on Spectroscopy

Here are some useful papers that can be downloaded from ADS-Harvard and the IMO.

A Perseid Meteor Spectrum

Meteor Spectroscopy with Inexpensive Holographic Gratings

Canadian Scientists Report-XII Meteor Spectroscopy with Transmission Diffraction Gratings

Current trends in meteor spectroscopy

One hundred and fifteen years of meteor spectroscopy

High resolution spectra and monochromatic images of a flaring 1991 Perseid meteor (Using Reflection Gratings)

IMO Photographic Handbook part 3


EMO Shower Spectroscopy Results

A typical Leonid meteor spectrum secured with an image intensified video spectrograph at EMO Courtenay, B.C. CANADA is shown below. This spectrum was secured using simple equipment. An experimental grade type MX9944/UV – 2nd generation 25 mm diameter image intensifier purchased on the surplus market was used. A standard Canon F-1.4 – 50 mm lens fitted with a precision 600 g/mm blazed B&L replica transmission diffraction grating imaged the spectrum on the image intensifier input screen.

The intensifier output screen was imaged by a Super 8 video camcorder recording on a standard  VHS recorder. The field of view is around 25 degrees. The “zero order” image of the meteor is on the extreme left. The “first order” spectrum is recorded with blue on the left with red to the right. The intensifier has rather limited sensitivity at the blue end so recorded lines are weak. Part of the red end of the spectrum was not recorded as it was off the screen to the right. The intensifier is mainly sensitive from around 450.0 nm to around 900.0 nm but as noted features below 450.0 nm are faint. Of special interest in this spectrum is the so called forbidden line of oxygen O I  3F recorded at 557.7 nm which is clearly recorded trailing the main spectrum. This line was first identified by Canadian astronomer, Ian Halliday in 1958. Earlier film spectra were reviewed and this was also found in an early Leonid spectrum designated as Number 29 on Millman’s World List of Meteor Spectra. See: R.A.S.C. Journal, Vol. 54, Number 4, p.189-192, August 1960.

This program was conducted on the morning of November 18, 2001. A total of 110 video meteor images were recorded during this program, 60 “zero order” images and 50 “1st order” spectra. A similar program was planned for 2002 but was unfortunately clouded out at my location.

I would like to thank Dr, Jiri Borovicka at Ondrejov Observatory in the Czech Republic for doing the scan of this spectrum.


Figure 1.  Leonid spectrum.  Time stamp is PST Pacific Standard Time +8 hrs for U.T.


Perseid Spectra

Figure 2.  Perseid Meteor Spectra


For comparison purposes a past Perseid meteor spectrum has been added.  It was secured with the same set-up as above. Frame capture was done on a MAC computer and saved in grey scale format.  The spectra scan is a composite carried out by Jiri Borovicka at Ondrejov Observatory.

Compare Perseid

Figure 3.  Perseid spectrum.  Time stamp is PDT  Pacific Daylight Time   + 7 hrs U.T.


Comare Fig 4

Figure 4. Sample of Photographic Meteor Spectra


Fig5 Perseid 1986

Figure 5. 1986 Perseid Meteor Spectrum with Objective Prism


Holographic TF

Figure 6. 8/9 June 1997 Holographic Thin Film Grating Spectrum

This sporadic meteor spectrum in Figure 6 was obtained using a Learning Technologies thin film holographic type grating. The spectrum is undergoing measurement by Dr. Josep M. Trigo Rodriguez of the Spanish Photographic Meteor Network. This is to establish whether these inexpensive type of gratings are useful for meteor spectroscopy by amateurs. The preliminary report was published by Ed Majden as a Research Note in the Journal of the Royal Astronomical Society of Canada: Vol 92: 91-92, 1998 April JRASC


Fig 7 spectra

Figure 7, 1983 Objective Prism Perseid Meteor Spectrum

A faint Perseid spectrum showing the O I forbidden line of Oxygen at 557.7 nm. Not published but sent to Peter M. Millman at NRCC for his evaluation. Sadly Dr. Millman passed away so I don’t know what became of the negative.

Edward Majden – R.A.S.C. Victoria Centre – A.M.S. Meteor Spectroscopy

EMO Courtenay B.C. CANADA Lat.49o 40′ 33.5″ N-Long. 125o 00′ 37.1 W (GPS)

The Spectrographs used by Ed Majden

Here is some of the spectral equipment in use at EMO.

F-24 Aero Camera lens cone with an f-2.9 – 8 inch f.l Pentac lens fitted with a 27 deg 45′ objective prism with a refractive index of 1.71 for the 589 nm line. This unit has been modified to accept a 4X5 inch 6 platen Graphmatic film holder.


Two Camseras


Two, 2-1/4 X 2-1/4 inch roll film type cameras mounted with objective transmission gratings behind a chopping shutter.  The grey Camera is a Bronica and the other is a Hasselblad. An automatic system using used Hasselblad EL/M motor driven cameras is being worked on.


Video intensifier


This is a video image intensifier spectrograph recording system using a 2nd generation 25 mm MCP Image intensifier and a Canon L2 Super 8 – 1/2 inch format video camera. Such a system will record spectra as faint as +3.0 magnitude where photographic systems using film with standard lenses are limited to meteors brighter than -2.0 magnitude. This unit is still under construction. I have recorded several video spectra of Perseids and Leonids with a prototype system. Copies have been sent to Peter Jenniskens at SETI/NASA for his meteor spectra archives. Hopefully they will eventually be measured. Since 9/11 it is unfortunately difficult to get U.S. built 2nd and 3rd generation intensifiers unless you are a U.S. resident.


2007 12 22 Ursid Outbreak

The 2007 Ursid Multi-Instrument Aircraft Campaign


In late December Jenniskens headed the 2007 MAC Ursid campaign. The shower is produced by ejecta from Comet 8P/Tuttle.

The Ursids shower of 2007 were predicted to peak between 2000 to 22:12 UT which favoured European observers. Radio observation
permitted me to observe the shower despite cloud cover and being on the wrong continent. As a station in NASA’s Global Meteor
Scatter Network, I submitted my initial radio data. The data from my forward scatter station, along those from others, were utilized Ames Research Center for analysis of the 2007 Ursid shower.

The shower was shakedown flight for the 2008 Quadrantid Multi-Instrument Aircraft Campaign, on January 3-4.


Electronic Telegram No. 1188
Central Bureau for Astronomical Telegrams
INTERNATIONAL ASTRONOMICAL UNION
M.S. 18, Smithsonian Astrophysical Observatory, Cambridge, MA 02138, U.S.A.
IAUSUBS@CFA.HARVARD.EDU or FAX 617-495-7231 (subscriptions)
CBAT@CFA.HARVARD.EDU (science)
URL http://www.cfa.harvard.edu/iau/cbat.html

URSID METEORS 2007
P. Jenniskens, SETI Institute, reports on elevated Ursid shower rates
between Dec. 22d18h and 23d01h UT, identified as dust ejected from comet
8P/Tuttle prior to 900 AD (cf. CBET 1159).  The outburst was detected in
radio forward-scatter meteor observations by E. Lyytinen (Helsinki, Finland)
during Dec. 22d18h-23d01h and by J. Brower (Vancouver, BC, Canada) during
Dec. 22d18h.5-22d22h.5.  I. Yrjola (Kuusankoski, Finland) reports that 25
Ursid meteors and 16 sporadic meteors were captured on video, with a peak at
around 21h15m, the Ursids being slightly brighter on average than other
meteors that night.
The International Meteor Organization gathered visual observations from
19 observers, who measured a peak ZHR = 34 ± 5 Ursids/hr (vs. predicted
40-70 meteors/hr) at solar longitude 270.53 ± 0.03 deg during Dec.
22d21h12m ± 42m, based on 116 Ursids (assuming a fixed population index
of chi = 2.5).  The predicted peak time was Dec. 22d20h-22d22h.2.

NOTE: These ‘Central Bureau Electronic Telegrams’ are sometimes
superseded by text appearing later in the printed IAU Circulars.

(C) Copyright 2007 CBAT

2007 December 31                 (CBET 1188)              Daniel W. E. Green

More to come…

2007 09 01 Aurigids Results

The 2007 NASA Aurigid Multi-Instrument Aircraft Campaign (MAC)


As a member of NASA’s Global Meteor Scatter Network I was asked to monitor the 2007 theta Θ-Aurigids shower. Dr. Peter Jenniskens of NASA  was conducting an elaborate airborne observation campaign, the Aurigid MAC.  Some of my radio data results for this campaign can be found on NASA’s Ames Research Center Aurigid MAC web pages.

Why was this shower important?

The shower is produced by the debris field from the passage of  Comet Kiess, C/1911 N1, over 2000 years earlier. The comet is long period comet; it made it’s first passage of the sun around 83 B.C. and competed it’s perihelion approach in 1911. It has been classified as a potential earth impactor. There have been other outbreaks in 1935, 1986, and 1994. Jenniskens and Lyytinen (2003) and Jenniskens and Vaubaillon (2007) predicted a strong outburst in 2007 lasting only an hour and a half. A pdf of the later can be found here.

The comet originated in the Oort cloud some 4.5 billion years ago. Gravity finally perturbed it enough to set it free from the cloud and sent it in bound for an orbit around the sun.

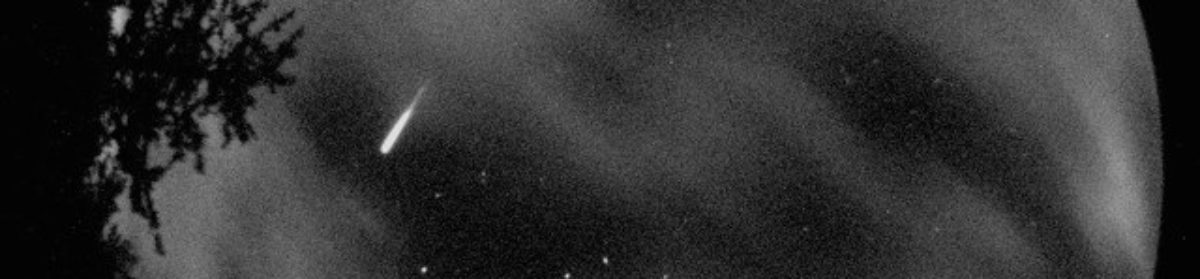
These are the preliminary results of the Aurigids as seen from Kelowna, British Columbia, Canada.

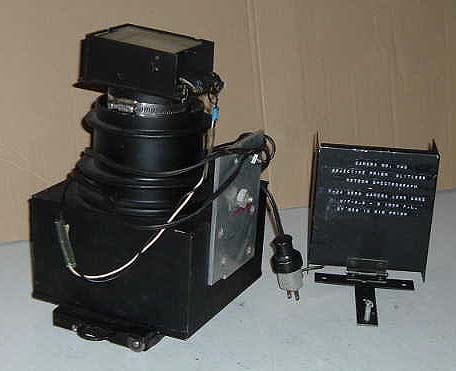
The station for this event consisted of two receivers and two antennas. My primary station listens at 61.260 MHz and uses an ICOM PCR-1000 software driven receiver was used with a 7 element log periodic antenna pointing due south. Counting software: Spectrum Lab FFT and mAnalyzer program.

My secondary station listens a 83.260 MHz an ICOM R-8500 receiver and a no gain, omni directional discone vertical were utilized. Counting software: mAnalyzer with 10 minute splits and Spectrum Lab running in parallel. Transmitters monitored were located in Bilings, Montana, and Bend, Oregon.

Saturation and Under Counts

The primary station began showing a decrease in echo counts starting at 1050 UT and continued depressed counts for about 60 minutes there after. This decline in echo counts was due to saturation, the overlapping of over dense echoes, keeping the software timers and counting routines triggered which led to some under counting the hourly echo counts. The secondary station is much less sensitive and as was hoped for, it did not have this problem during the peak shower.

Primary frequency 61.260 MHz, channel 3 plus offset,  shows the onset of long over dense echoes beginning at 1055 UT and continuing nearly 50 minutes. The recording starts at 0141 UT, blue ticks = 1 minute, red = 1 hour. For display, the spectrogram was set up to show only the brightest echoes, those equal to or stronger than 20 dB . The software  itself recorded all strengths of echoes from 10 dB, 20 dB, 30 dB, and greater than 30 dB  bins as well as the  the duration of each bin.

Brower's Aur outbreak

A very sharp increase in strong, overdense echoes began at 1050 UT. Based on the 10 minute data from both stations, the shower peaked around 1110-1125 UT, September1, 2007.

Results were summarized in CBET 1049:

Electronic Telegram No. 1049
Central Bureau for Astronomical Telegrams
INTERNATIONAL ASTRONOMICAL UNION
M.S. 18, Smithsonian Astrophysical Observatory, Cambridge, MA 02138, U.S.A.
IAUSUBS@CFA.HARVARD.EDU or FAX 617-495-7231 (subscriptions)
CBAT@CFA.HARVARD.EDU (science)
URL http://www.cfa.harvard.edu/iau/cbat.html

2007 AURIGID METEORS
P. Jenniskens, SETI Institute, reports that observations onboard
two research aircraft over Nevada and California indicate that the
anticipated Aurigid outburst (cf. CBET 1045) from the 1-revolution
dust trail of comet C/1911 N1 (Kiess) did occur on Sept. 1 between
10h30m and 12h00m UT, with a peak at 11h15m +/- 5 minutes (the predicted
peak time was 11h33m +/- 20 min).  The peak rate was within a factor of
two of that expected.  Most meteors were in the magnitude range -2 to +3,
as anticipated.
C. Steyaert, Vereniging Voor Sterrenkunde, Belgium, writes that
several stations of the ‘Radio Meteor Observatories On Line’ collaboration
(http://radio.data.free.fr/main.php3) report high Aurigid activity on
September 1.  A. Smith, Tavistock, U.K., observing at 143.050 MHz, found the
Aurigids to be “very active with big fireballs” between Sept. 1d10h45m
and 1d12h10m UT.  J. Brower, Kelowna, B.C., Canada, observing at 61.26 MHz,
found that “heavy, overdense echoes had a sudden onset starting” during
Sept. 1d10h50m-1d11h00m and continued to be heavy for an hour.  W. Camps,
Tessenderlo, Belgium, observing at 49.990 MHz, observed the following
counts at 10-minute intervals starting:  Sept. 1d10h00m, 6; 1d10h10m, 3;
1d10h20m, 4; 1d10h30m, 2; 1d10h40m, 4; 1d10h50m, 2; 1d11h00m, 7; 1d11h10m,
4; 1d11h20m, 7; 1d11h30m, 7; 1d11h40m, 3; 1d11h50m, 3; 1d12h00m, 4;
1d12h10m, 2; 1d12h20m, 2; 1d12h30m, 1; 1d12h40m, 1; 1d12h50m, 2.
J. M. Trigo-Rodriguez, Institut de Ciencies de l’Espai and Institut
d’Estudis Espacials de Catalunya, Bellaterra (Barcelona), reports that no
signs of Aurigid activity were recorded from Catalonia, Spain, via the
all-sky CCD cameras of the Spanish Meteor Network on Sept. 1d00h30m-
1d04h30m UT.  Meteors of magnitude 3 or brighter were recorded radiating
from the Aurigid radiant, and there were no signs of fireballs from the
dust trail of comet C/1911 N1.

NOTE: These ‘Central Bureau Electronic Telegrams’ are sometimes
superseded by text appearing later in the printed IAU Circulars.

(C) Copyright 2007 CBAT
2007 September 3                 (CBET 1049)              Daniel W. E. Green


Graphs Depiction of the outbreak at West Kelowna.

61.260 MHz Primary frequency Echo Count data:

multi61260_echo_10min

61.260 MHz Primary frequency Echo Duration data:

multi61260_dur

61.260 MHz Primary frequency Mean Echo Duration data:

multi61260mdur

83.260 MHz Secondary frequency Echo count data:

83260ma_10_echoes

83.260 MHz Secondary frequency Duration data:

83260ma_durs

83.260 MHz Secondary frequency Mean Duration data:

83260ma_10_meandur

Jenniskens, P., and J. Vaubaillon (2007), An Unusual Meteor Shower on 1 September 2007, Eos Trans. AGU, 88(32), doi:10.1029/2007EO320001.

Lyytinen, E., and Jenniskens (In press 2003), P. Meteor Outburst from Long-Period Comet Dust Trails. Icarus.


VLF and Meteors Links

Please check out these links for a discussion of VLF signatures from meteors:

Beech M, Brown P & Jones J, VLF detection of fireballs, Earth Moon & Planets (Netherlands), 68 (1995) 181.

Beech M, & Foschini, L., Leonid Electrophonic Bursters, Astronomy and Astrophysics 367, (2001), 1056.

Beech M, & Foschini, L., A space charge model for electrophonic bursters, Astronomy and Astrophysics 345 (1999) L27

Rault, Jean-L., On the potential meteors ELF/VLF radiations Perseids 2009 campaign. (2010)